Superimpose Distribution Functions Plots for a distr6 Object
Source:R/lines.R
lines.Distribution.RdOne of six plots can be selected to be superimposed in the plotting window, including: pdf, cdf, quantile, survival, hazard and cumulative hazard.
# S3 method for class 'Distribution'
lines(x, fun, npoints = 3000, ...)
Arguments
Details
Unlike the plot.Distribution function, no internal checks are performed
to ensure that the added plot makes sense in the context of the current plotting window.
Therefore this function assumes that the current plot is of the same value support, see examples.
See also
plot.Distribution for plotting a distr6 object.
Examples
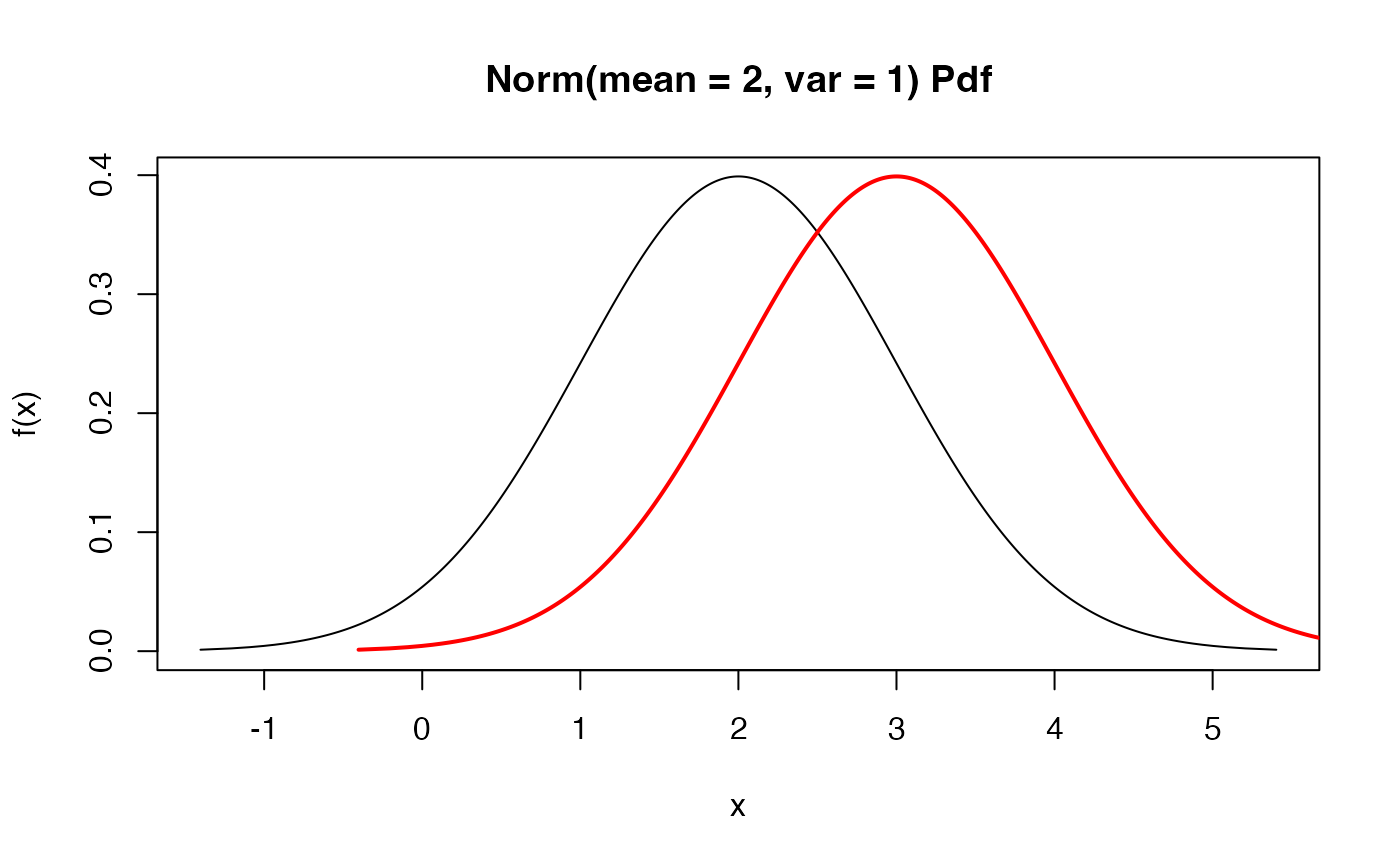
plot(Normal$new(mean = 2), "pdf")
lines(Normal$new(mean = 3), "pdf", col = "red", lwd = 2)


if (FALSE) { # \dontrun{
# The code below gives examples of how not to use this function.
# Different value supports
plot(Binomial$new(), "cdf")
lines(Normal$new(), "cdf")

# Different functions
plot(Binomial$new(), "pdf")
lines(Binomial$new(), "cdf")

# Too many functions
plot(Binomial$new(), c("pdf", "cdf"))
lines(Binomial$new(), "cdf")
} # }
if (FALSE) { # \dontrun{
# The code below gives examples of how not to use this function.
# Different value supports
plot(Binomial$new(), "cdf")
lines(Normal$new(), "cdf")
# Different functions
plot(Binomial$new(), "pdf")
lines(Binomial$new(), "cdf")
# Too many functions
plot(Binomial$new(), c("pdf", "cdf"))
lines(Binomial$new(), "cdf")
} # }